Blog

Pork: The Other Red Meat

Remember the long running campaign by the Pork Board?

pork_white.JPG

The campaign pitching pork as the other white meat made sense at a time when there was rising concern about fat content and red meat consumption and increased competition from chicken.  But, times have changed.

One of the changes has come about from scientific developments.  As it turns out, pork color is a good indicator of eating quality, and in blind taste tests, consumers prefer redder pork to whiter pork.  Do consumers know this?  Could a quality labeling system help coordinate the pork supply chain and better align production with consumers' eating expectations?

These were the questions that led to this paper just released by the journal Food Policy that I co-authored with Glynn Tonsor, Ted Schroeder, and Dermot Hayes with funding by the National Pork Board (a longer report of the results is here).

We surveyed about 2,000 consumers for the analysis reported in the Food Policy paper.  We were mainly interested in how consumers' choices between pork (and other meat) products varied with the color of the pork and whether and which kinds of labels were present.  Consumers were randomly assigned to a control (with no labels) or one of several treatment groups that utilized different labeling systems.  Below shows a particular choice question used in the various treatments.  

pork_1.JPG

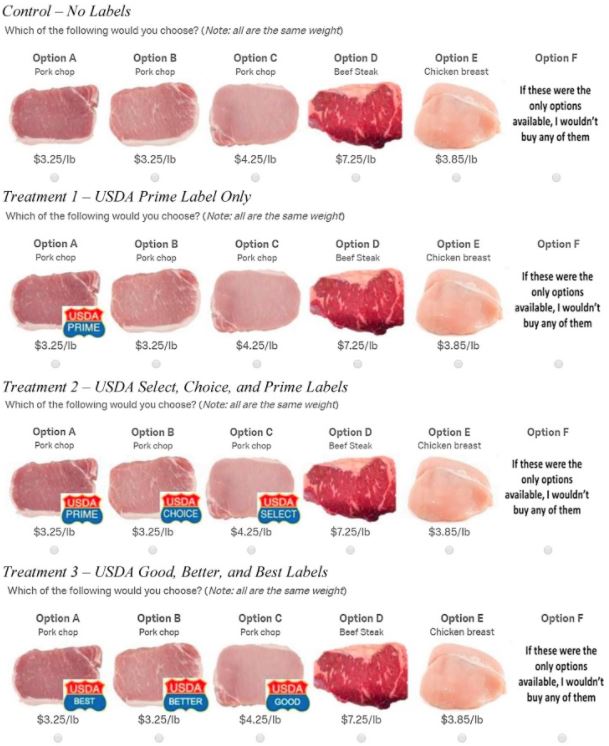
We use the choices consumers made in these treatments to back out consumers' willingness-to-pay, but even more importantly, the probability a consumer buys any type of pork and the expected revenue from pork.  For the economists out there, I'll note that we also have some methodological innovation.  Rather than just looking at the probability of buying a type of pork at a given set of prices, we also invert the equations to look at the equilibrium price of pork at a given quantity of different types of pork (this is important because in the short run, pork producers can't easily produce a larger amount of higher quality pork).

So, what did we find?

pork_wtp.JPG

We find: 

In the absence of a cue in the “no labels” control, on average, participants do not differentiate among the three quality levels [or pork colors]. There is no significant difference in average WTP [willingness-to-pay] for the three different colored chops. This is consistent with industry interest in adding quality labels to facilitate further separation of pork quality by consumers. The introduction of a single Prime label for the highest quality chop in Treatment 1 results in a significant increase in the WTP for the chop that would carry the highest quality grade; however, there is a significant reduction in WTP for the lower quality chops that did not carry labels in this treatment.  ... When all pork products have grade labels, there is a significant premium for higher vs. lower quality pork and total pork sales rise, as do expected revenues. This can be seen in [the figure] as the mean WTP estimates for all pork qualities lie above those in the control condition with no labels.

We go on to show there is significant heterogeneity in consumer preferences.  We find that 28% to 40%, depending on the labeling condition, of consumers prefer white pork to red pork.  

From the conclusions: 

The choice experiment data analysis suggests that a USDA grade using Prime, Choice, and Select or Good, Better, Best labels would be most likely to increase expected pork revenue and the probability of purchasing pork. Additional important opportunities are present within this strategy. Foremost is that even with quality labels on the pork chops, a significant fraction of consumers preferred lower quality than Prime even when the three quality products were priced the same. Such consumers either do not understand the quality grade rankings of Prime, Choice, and Select (though results were similar for Best, Better, Good, which should be less prone to confusion), or this group of consumers were ignoring the quality grade labels and relying on product color to influence their choices. A possible response would be to segment consumers and to use the grading system only on those consumers who prefer red chops. Segmentation could be done by exploring preferences across states, institutions, income categories, ethnicity, and by export market. Despite the possibility for segmentation, however, we show, that if all qualities are present, only labeling the highest quality is likely to reduce total pork sales and revenue

As this piece in the Federal Register indicates, the USDA Agricultural Marketing Service is seeking public comment on the usefulness of such a labeling system.  Maybe one day in the future you will see new pork quality grade labels in the grocery store.  

Impacts of health information on perceived taste and affordability

The journal Food Quality and Preference just released a new paper I co-authored with Jisung Jo, a former student who now works at the Korea Maritime Institute.

Here is the motivation for the work:

One of the key mechanisms policy makers have utilized to encourage healthier eating is the provision of information via nutritional labels. However, research has shown that the provision of health information does not necessarily increase consumption of healthy foods ... A possible reason for the largely ineffectual impact of nutritional labeling might be because health information not only updates consumers’ health perceptions but also affects other perceptions, such as taste and affordability, which are the primary drivers of consumer purchase behavior

In other words, if you see a new labeling indicating a food is healthier than you previously thought, do you now think it will be less tasty?  Or more expensive?  

To explore this issue, we surveyed consumers in three different countries (US, China, and Korea).  We showed consumers a picture of a food item and asked them to rate the item, on simple scales, in terms of perceived taste, health, affordability, and purchase intention.  We did this for 60 diverse food items. Then, the ratings of all 60 foods was repeated after the subjects had received information about each food item’s healthiness, which was conveyed via a "traffic light" labeling system (green=healthy, yellow=medium healthiness, red=unhealthy).   Here's an example of one of the questions asked before and after the information:

jisungFQP1.JPG

Unsurprisingly, the provision of "green" labels tended to increased perceived healthiness and the provision of "red" labels tended to reduce perceived healthiness.  Of more interest is how these labels affected perceptions of taste, affordability, and ultimately purchase intentions.  

Unexpectedly, we found that providing information that a food was healthier than people previously thought tended to increase perceived taste.  People also tended to think items that are less healthy than previously thought will ultimately be less expensive.

We created the following graph to look at how projected changes in purchase intentions (after provision of health information) would change if one ignores the fact that health information also affects perceived taste and affordability.

jisungFQP2.JPG
Across all scenarios and in all three countries, we find that negative health information has the biggest effects on purchase intention changes. Intriguingly, the average purchase intention in scenario B is larger than that in scenario A. The values for scenario D are the same as the actual average of purchase intention (since they are just the model evaluated at the mean effect changes of all variables included in the model). Comparing the purchase intention changes as one moves from scenario A to D shows the effect of ignoring integrated health-taste-affordability perceptions.

Overall, this research underscores the need to understand how labels which convey health information might also alter other perceptions related to taste and affordability.

Want non-GMO? How much more will it cost?

The journal Food Policy just released a new paper I co-authored with Nicholas Kalaitzandonakes and Alexandre Magnier entitled, "The price of non-genetically modified (non-GM) food." 

As retailers consider reformulating products or how they'll respond to new mandatory labeling laws, it is important to consider how these decisions may affect the prices consumers pay for foods that avoid GMOs.  The matter is increasingly of note because sales of non-GMO products have significantly risen over time (below is a graph from the paper showing the trend in sales of breakfast cereal making non-GMO claims).

nongmocerealsales.JPG

In the paper, we used a U.S. national sample of grocery store scanner data from the years 2009- 2016 to investigate the prices stores charged for 144 different salad and cooking oil products (or Universal Product Codes, UPCs), 1,288 tortilla chip UPCs, 2,227 breakfast cereal UPCs, and 5,626 ice cream UPCs. We picked these product categories because they represent classes of products for which the potential impact of changes in the raw ingredients on the final retail price might be large (i.e., soybean or corn oil for which the supply is primarily GMO) to small (i.e., ice cream where the value share of GMO crops and their derivatives (e.g. corn syrup) is probably less than 5%).

Here's a short summary:

we use hedonic modeling to estimate the retail price premiums consumers paid during the 2009–2016 period for non-GM and organic foods in four product categories: breakfast cereal, tortilla chips, salad and cooking oil, and ice cream. There are almost 11,000 ready-to-eat foods in our sample, 1350 of which are labeled as non-GM or organic. We selected these four product categories for their differences in the value shares of GM ingredients and hence their potential differences in reformulation costs. We show that the estimated price premiums for non-GM and organic foods in these four product categories are in line with the expected added costs for supplying such products.

The key results are summarized in the table below:

nonGMOprice.JPG

We write:

The estimated price premiums paid by US consumers over the 2009–2016 period, 9.8% to 61.8% for non-GM products and 13.8% to 91% for organic products in the four categories examined here, are orders of magnitude higher than those projected by economic impact analyses of proposed mandatory GM labeling produced in recent years

and

Perhaps the most important conclusion to be drawn from our results is that non-GM foods are more costly than GM foods, and policies that encourage food companies to shift toward non-GM ingredients are likely to increase food costs. Our results therefore suggest that there is a pressing need for further research in order to clarify the added costs consumers may have to pay under mandatory disclosure of GM ingredients and how such added costs might be distributed.

Market Potential for Cage Free Eggs

Many food manufacturers and retailers have made pledges to go "cage free."  In fact, if all the pledges are maintained, about 75% of the entire egg laying flock will have to be converted to cage free by the year 2025, as the graph below suggests.     

eggmarketshare.JPG

Is there sufficient consumer demand to support this level of commitment (particularly when one acknowledges that, according to USDA data, cage free eggs are currently selling at about a $1/dozen (or 68%) premium to conventional)?

I recently completed a study for the Food Marketing Institute, Animal Agriculture Alliance, and the Foundation for Food and Agricultural Research on the market potential for cage free eggs to help provide some insights into these issues.

The study was conducted with more than 2,000 consumers.  The core of the study involved people making a series of simulated retail shopping choices like the one below.  

CE_egg.JPG

Answers to these questions allow us to infer consumer willingness-to-pay, market shares, and more.  In fact, if you want to run your own market share simulations, I created this handy downloadable spreadsheet.

The main finding is the following:

When provided no additional information, choices imply half of consumers are willing to pay no more than a $0.30/dozen premium for cage free eggs; however, the mean premium is $1.16/dozen, suggesting a small fraction of consumers are willing to pay sizeable amounts for the cage free label. Almost 60% of consumers have a willingness-to-pay for cage free less than $0.40/dozen, but 33% have a value greater than $1.00/dozen.

and

Ultimately, the results suggest there is potential for the market-share for cage free eggs to rise above the current state even at premiums as high as $1.00/dozen. However, even at much more modest price premiums, the potential for cage free eggs to attain majority market share is unlikely, particularly if conventional eggs advertise other desirable attributes. Completely removing more affordable conventional eggs will significantly increase the share of consumers not buying eggs.

Here are a couple key graphs:

WTP_hist_egg.JPG

and

eggmarketshare2.JPG


There is much, much more in the full report, and you can also download the market share simulator here.

How to Feed the World

That's the title of a new book edited by Jessica Eise and Ken Foster that was just released last week.  The book is a collection of essays primarily from my colleagues in the Department of Agricultural Economics here at Purdue, but it includes contributions from Purdue faculty in other academic disciplines as well.  I had the privilege of writing the afterward.  

Here is the table of contents:

Chapter 1. Inhabitants of Earth- Brigitte S Walforf
Chapter 2. The Green, Blue, and Gray Water Rainbow- Laura C Bowling and Keith A Cherkauer
Chapter 3. The Land that Shapes and Sustains Us- Otto Doering and Ann Sorensen
Chapter 4. Our Changing Climate- Jeff Dukes and Thomas W Hertel
Chapter 5. The Technology Ticket- Uris Baldos
Chapter 6. Systems- Michael Gunderson, Ariana Torres, Michael Boehlje, and Rhonda Phillips
Chapter 7. Tangled Trade- Thomas W Hertel
Chapter 8. Spoiled, Rotten, and Left Behind- Ken Foster
Chapter 9. Tipping the Scales on Health- Steven Y Wu
Chapter 10. Social License to Operate- Nicole J Olynk Widmar
Chapter 11. The Information Hinge- Jessica Eise
Chapter 12. Achieving Equal Access- Gerald Shively

eisebook.JPG