Blog
Restaurant Spending by Vendor and Location
My team in the Center for Food Demand Analysis and Sustainability (CFDAS) at Purdue University has worked to create two new data dashboards showing consumer spending at restaurants and for food delivery. We partnered with the firm Facteus, which processes debit/credit card transactions, and we use their data to understand trends, geographic differences, and rankings of restaurant in terms of consumer spending.
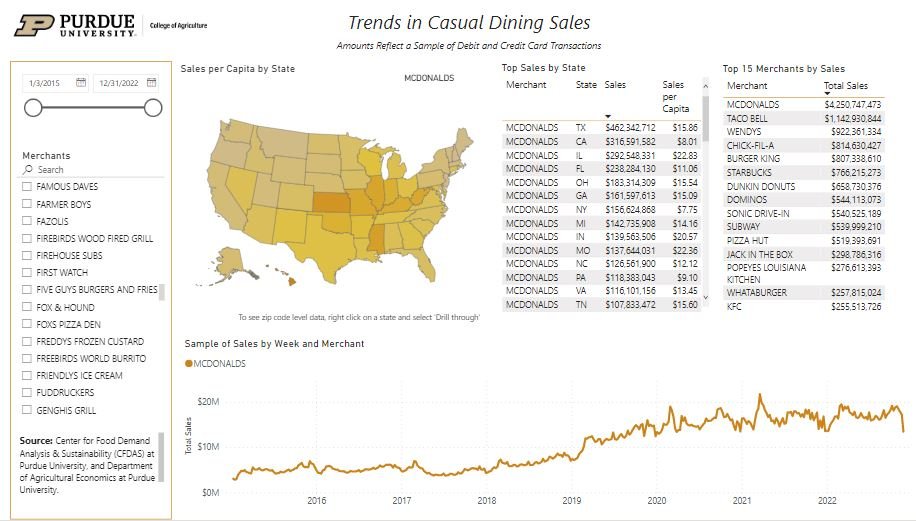
The first dashboard shows spending at restaurants, including fast food and casual dining (be patient: it might take a few seconds to load; the dataset is HUGE!). The figure below shows the dashboard set to McDonalds (the restaurant with the most sales). Apparently, Kansas is the state with the highest per-capita expenditures at McDonalds, although the highest McDonalds spending occurs in zip codes in Texas and California. The time trend shows McDonalds sales fared pretty well during the pandemic.
By contrast, if we look at a more traditional “sit down” restaurant like Applebee’s, the dip in sales during the pandemic is much more noticeable.
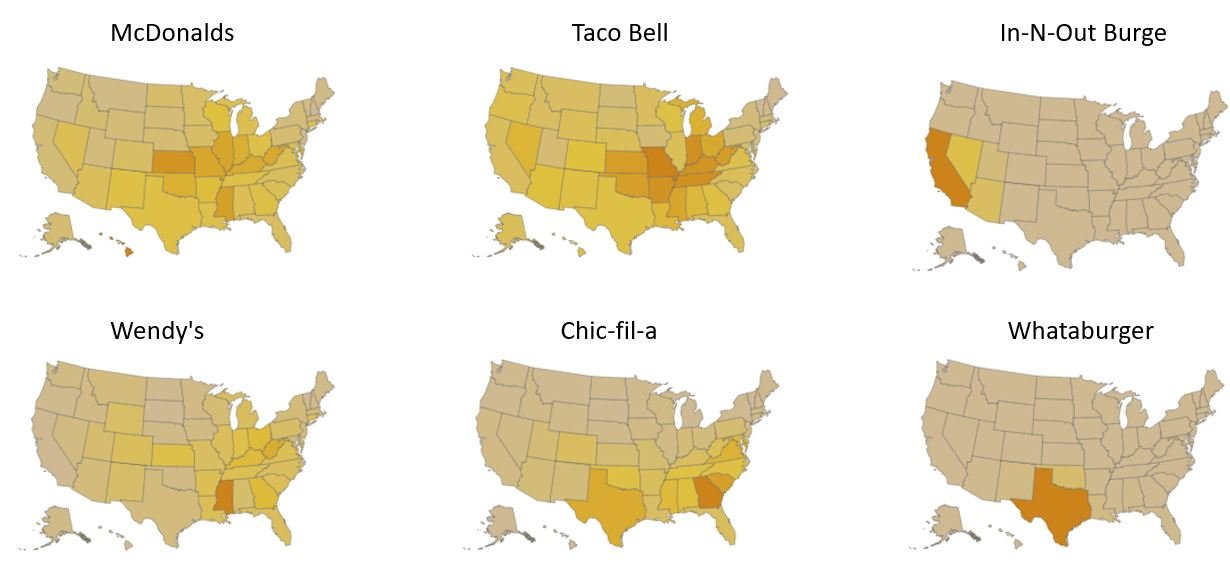
It is fun to look at geographic patterns in per-capita spending. For example, here are several top-selling fast food chains along with a couple regional favorites, including my personal favorite, Whataburger (yes, I am a Texas native).
You can even zoom in to the zip-code level if you want to see spending variation within a state. Have fun playing around with the dashboard yourself.
We have a second dashboard that looks similar except it shows spending patterns on meal delivery apps. Here is a screenshot of spending on Uber Eats, which clearly benefited by the pandemic.
We are looking forward to really digging into these data as we aim to better explore consumers food buying behavior in these food-away-from home markets.
Consumer Food Insights - December 2022
The latest edition of our Consumer Food Insights (CFI) report from the Center for Food Demand Analysis and Sustainability (CFDAS) is now out. In this edition, we took a look back at the trends that have occurred over the first full year of the survey and explore some issues related to Holiday spending.
So, what changed over the course of 2022?
Food spending increased over 15% from the start to the end of the year; most of that increase happened in early summer and spending has been fairly flat for the past several months.
Consumers reported a rise in food prices paid over the course of the year; however, their expectations about future food price rises has fallen since June and reached a low in December.
Consumers are experiencing fewer stock-outs. Back in January, about 25% said they were unable to find specific products they wanted to buy at the grocery store. In December, the figure was only 14%.
There is a downward trend in online grocery shopping. Back in January 21% said they bought groceries online. By December, this figure had fallen to 15%.
In response to higher food prices, in December 22% of consumers said they were switching to cheaper brands, the highest percent recorded over the course of the year.
What hasn’t changed over the course of 2022?
Food insecurity rates have remained steady.
There is no noticeable trend in stated satisfaction or happiness with food.
Our Sustainable Food Purchasing (SFP) Index hasn’t much changed.
The share of consumers who reported being vegetarian or vegan is essentially flat.
Specific consumer shopping and eating habits remain steady. These included items like how often people choose cage-free over conventional eggs or choose organic over non-organic or choose local over non-local foods or check nutrition labels.
We added some questions specifically about Holiday spending (our survey was in the field just prior to Christmas). A little over a third of consumers (36%) said they were worried about affording holiday gifts. Of those who were worried, the most common stated response to how people were responding was more shopping at discount stores and spending less on gifts followed by spending less on restaurants and takeout.
Finally, in addition to our usual tracking questions, we added some questions about perceptions of treats to U.S. farm production and American well being as well asking questions about perceptions about effects of various actions on sustainability and well-being. Those results and more are available in the full report.
Looking back on 2022
2022 was a full and exciting year. In addition to my Department Head duties and typical research activities, last year was very busy with the launch of the Center for Food Demand Analysis and Sustainability (CFDAS) and the Consumer Food Insights (CFI) survey. Virtually all the content on the CFDAS website was created in 2022, and I’m grateful for a talented group of colleagues who helped make all that happen.
Here on the blog, there were 38 new posts garnering over 63,000 pageviews. The five most popular posts from 2022 include:
It’s hard to believe, but 2022 marked the 10th year anniversary of this blog. While much has changed in the last decade, including the rise and (not-quite-yet) fall of Twitter and the emergence of other media platforms that made it easier to communicate beyond traditional academic journal formats, I’ve found this blog to be an indispensable resource. If nothing else, it has served as good record for me to remember what issues have occupied my attention in the past. As I looked through website analytics the past couple years, the most widely viewed posts are now typically those written two or three years ago. There is immense satisfaction in creating and owning some of that content that continues to attract attention. Thanks to all who have followed along over the past 10 years!
Happy New Year!
Consumer Food Insights - November 2022
The November 2022 results from our monthly Consumer Food Insights survey from the Center for Food Demand Analysis and Sustainability at Purdue University are now out.
As I discussed in my last post, despite the continuation of high food price inflation, our measures of food insecurity remain steady. Moreover, if we focus on a particular measure: whether more people are getting food from food banks, we also see no substantive uptick.
Broadly, we find that food at home (FAH) spending remain flat and is at roughly the same level as back in May despite continually rising prices since that time.
This month, we did a deeper diver into how consumer spending patterns, behaviors, and beliefs differed across geographic regions of the United States. We don’t yet have enough data at the state level to focus in at that granularity, so we looked at differences across the nine Census Regions across the U.S. (you can check out the map in our report to see which states fall in which regions).
We find that households closer to the coasts spend much more per week on food - both food at home (FAH) through grocery and food away from home (FAHF) through restaurants.
Despite greater food spending on the coasts (or perhaps because of it), households on the coasts are experiencing lower rates of food insecurity.
Intra-region differences in food behaviors demonstrate that broad geographic labels like Northeast vs. South are not terribly precise for comparing the food preferences of Americans.
As was the case last month, we added some new questions to compare with the recent Apollo Academic Survey conducted in collaboration with William Masters at Tufts University. That survey asked leaders, fellows, and awardees of the American Society of Nutrition and the Agricultural and Applied Economics Association (i.e., the experts) about their views on nutrition and policy. Our goal, down the road, is to compare views of experts to those of the general public.
We found Americans primarily blame reduced physical activity for the rise in national obesity rates and rank better access to healthy foods as their top policy priority for improving overall health. Using taxes to encourage healthier food consumption was the least popular option among the public.
There is a lot more in the report, which you can download here.