Blog

How has medical spending changed and why

Last week, I gave a plenary address to the annual meeting of the American Association of Clinical Endocrinologists on the topic of obesity and the government's role in addressing the issue.  

In my talk, I showed the following graph illustrating the change in spending on medical care expressed as a percentage of GDP from 1960 to 2012 (I created the graph using data from here)

People often use this sort of data to try to illustrate the adverse consequences of obesity and other dietary-related diseases that have risen over time.  That is part of the story.  But, it is also a complicated story, and a lot has changed over time.  

One partial explanation for the change is that Medicaid and Medicare didn't exist in 1960; some of the spending by these programs in 2012 would have occurred anyway but some probably wouldn't have (i.e., some people would have delayed or foregone treatments if they weren't covered by these programs), so that's part of the story.  But, it can't be a huge part, as these two program make up less than half of total spending in 2012.

Another reason we likely spend more of our GDP on medical care today than we did in 1960 is that we are today richer.  Health care is a normal good, meaning that we buy more of it when we become wealthier.  Here, for example, is a recent cross-sectional comparison of how countries that differ in terms of per-capital GDP spend money on health care.

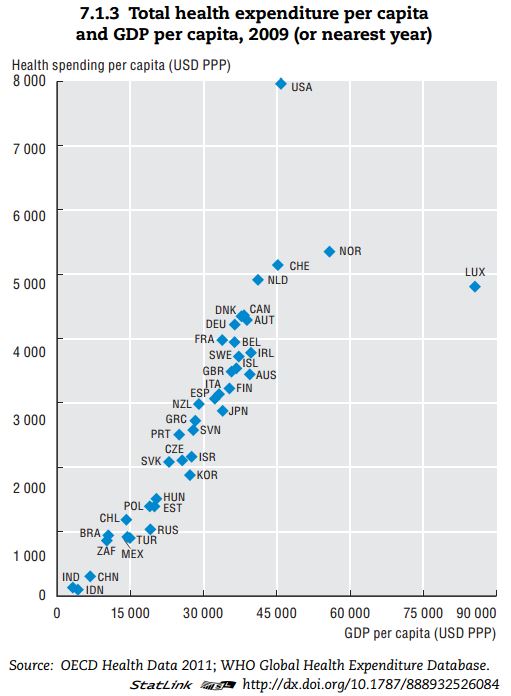
Clearly, the US is an outlier.  But, don't let that distract from the main message of the graph.  Richer countries spend more on health care.  It is almost a perfectly linear trend except for the US and Luxembourg.  

So, let's do a little thought experiment.  In real terms, per-capital GDP in the US in 1960 was around $15,000, whereas today it is around $45,000.  Look at the graph above,  Countries that make around $15,000 in per-capita GDP spend about $1,000/person/year on heath care.  Countries that make around $45,000 in per-capita GDP spend about $5,000/person/year on heath care.  Extrapolating from these data would suggest that we're spending $4,000 more per person on medical care in the US today than we did in the 1960s simply because we're richer today than in 1960.  

If I take 2012 cross-sectional WHO data (173 countries) from here and here, I find the following relationship from a simple linear regression: (spending on medical care as a % of GDP) = 6.47 + 0.033*(GDP per capita in thousands of $).  P-values for both coefficients are well below 0.01.  As previously stated, US GDP per capita has gone up by about $30,000 since 1960.  This means, we would expect the % of our GDP spent on health care to be 30*0.033=0.99 percentage points higher simply as result of income changes.

One final thought experiment.  We are a lot older today than in the 1960s.  For example, 35.9% of the population was under the age of 18 in 1960.  Today that figure is only 24%.  Older people spend more on health care than younger people.  Thus, we'd expect more spending on medical care today than in 1960 because we have more older people today.

Thus, I thought I'd do a crude-age adjusted calculation of medical spending as a % of GDP.    

I pulled data on per-capita spending by age category from the Centers for Medicare and Medicaid Services, Office of the Actuary, National Health Statistics Group and data from the Census Bureau on distribution of age in 2010 and 1960.

Here is the data and my calculations.

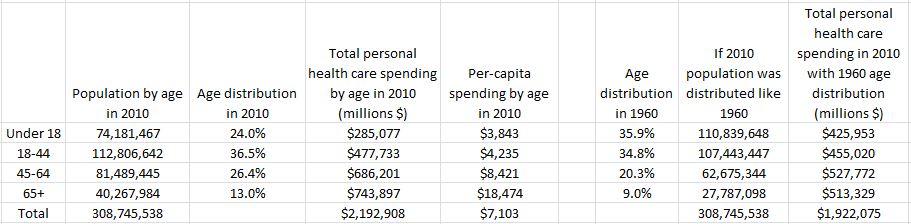
The last two columns construct a counter-factual.  The second to last column multiplies the 1960 age distribution by the total population in 2010; it imagines a world as populated as our current one but with ages distributed like 1960.  The last column calculates expected spending on health care with this 1960 age distribution by multiplying per-capita spending by the counter-factual age distribution.

The data suggest we actually spent $2,192 billion on medical spending in 2010.  However, if our nation had been younger, like it was in 1960, we would have only spent $1,922 billion.  Thus, we're spending 14% more in total on health care in 2010 than in 1960 because we are today an older population (of course we're also spending more because there are more of us).  If I express these figures as a percentage of 2010 US GDP, I find that current medical spending (as determined from this particular set of data) is 14.7% of GDP.  However, if we had the 1960 age distribution, medical spending would only be 12.8% of 2010 GDP.

In summary, increasing medical expenditures might indeed be a cause for alarm.  But, that rise is also partially explained by the fact that we are today richer and living longer.  I'd say that's a good thing.

Assorted links

Author of study suggesting sensitivity to gluten now has new research showing no ill effects


Baylen Linnekin writing at Reason.com on the documentary Fed UP, and the idea that we should have taxes on sugar-containing foods and drinks:

But why should government screw Americans twice? Why tax us to give a needless handout to farmers who raise crops that are turned into sweeteners and then tax us a second time as punishment for buying the products that contain those sweeteners? Where's the logic in that?


When comparing rates of obesity over time, this research shows you need to do more than just "age adjustment" but rather adjust for a host of demographic characteristics:

We find that changes in demographics are partly responsible for the changes in the population distribution of BMI and are capable of explaining about 8.6% of the increase in the combined rate of overweight and obesity among women and about 7.2% of the increase among men


This WSJ post on the liberal-conservative index associated with eating establishments was interesting.  Although there is a need to control for geography before drawing firm conclusions, I found it interesting that Chipotle had one of the highest conservative-liberal gaps.  Might tell us a little something about the target audience of those Chipotle videos.


Urban greengrocers are back

The new dietary wisdom

Carbs are out.  Fats are in.  

We seem to be bombarded by messages these days warning of the evils of carbs, particularly sugar.  The recently released documentary, Fed Up, produced by Katie Couric presents one conspiratorial, over-wrought perspective on the issue.

In their indictment of farm policies, somehow the makers of Fed Up, failed to look at some of the best economic research on the topic, which shows that sugar import quotas, among other policies, make US sugar prices 2-3 times higher than the world price.  Moreover, ethanol policies have driven up the price of corn and have made high fructose corn syrup (HFCS) more expensive as well.  Here, for example, is USDA data on the price of HFCS over the past 14 years.  As you can see, prices have more than doubled since 2005.

Of course, that's just one example.  This week in the Sunday Review edition of the New York Times ran an editorial by David Ludwig and Mark Friedman, which a argued that over-eating is actually making us hungrier.  They seem to place the blame mainly on carbs, writing:

By this way of thinking, the increasing amount and processing of carbohydrates in the American diet has increased insulin levels, put fat cells into storage overdrive and elicited obesity-promoting biological responses in a large number of people. Like an infection that raises the body temperature set point, high consumption of refined carbohydrates — chips, crackers, cakes, soft drinks, sugary breakfast cereals and even white rice and bread — has increased body weights throughout the population.

One reason we consume so many refined carbohydrates today is because they have been added to processed foods in place of fats — which have been the main target of calorie reduction efforts since the 1970s. 

Last week, the Wall Street Journal also ran an editorial on the issue by Nina Teicholz, who has a recently released book, The Big Fat Surprise: Why Butter, Meat and Cheese Belong in a Healthy Diet.  In the editorial, she argues that past nutritional guidelines that emphasized carbs and demonized fat were a major cause of the rise in obesity, writing:

Seeing the U.S. population grow sicker and fatter while adhering to official dietary guidelines has put nutrition authorities in an awkward position. Recently, the response of many researchers has been to blame "Big Food" for bombarding Americans with sugar-laden products. No doubt these are bad for us, but it is also fair to say that the food industry has simply been responding to the dietary guidelines issued by the AHA and USDA, which have encouraged high-carbohydrate diets and until quite recently said next to nothing about the need to limit sugar.

Indeed, up until 1999, the AHA was still advising Americans to reach for "soft drinks," and in 2001, the group was still recommending snacks of "gum-drops" and "hard candies made primarily with sugar" to avoid fatty foods.

Teicholz does a good job describing how previous dietary guidelines were based on tenuous scientific evidence and largely represented group think and a desire to "do something."  

Here's my question: How can we be so sure we now know more?  It seems to me this history lesson would cause us to be much more cautious about what we know about nutritional science and about the ability of public policy to beneficially affect food choice, weight, and health.  Yet, the aforementioned writings, and others, often contain as much hubris as ever.  It is unhealthy to eat too many carbs (or too much fat for that matter), but do we really know enough to design policies that will have intended effects?  I'm skeptical.

One reason is that writings by medical doctors and nutritionists on carbs often narrowly focused and miss larger "macro" issues.  Here, for example, is USDA data on per capita sugar consumption.  I've added in the recent trend lines, which show a strong downward trend in consumption over the past decade.

I suspect some of the downward trend is due to increased public awareness of the dangers of over-consumption of sugars, but also because of market conditions and aforementioned government policies.   

Another factor that many of these writers seem to overlook is that we grow a lot of carb-producing grains not just because of nutritional guidelines but because of economic forces.  The reality is that, by far, the most cost efficient producers of calories and protein are crops like corn, wheat, soybeans, and rice.  Historically, the challenge has been (and it remains a current challenge in many parts of the world), producing enough food and calories to keep pace with a growing population.  Moreover, if you're concerned about environmental issues, you also want to get as many calories and nutrients using the least amount of land and other resources, and that's precisely why economic forces lead farmers choose to grow so much corn, wheat, soybeans, and rice (not to mention these can be stored and will not spoil and waste soon after harvest).  I'm not saying we shouldn't re-think how much of these types of grains we eat, often in processed food, but I think it is useful to have some perspective on why these crops are so prevalent on our farms and in our diet.

I'll conclude with this passage I recently read from Sara Hara, a nutritionist who was dismayed by what she saw in Fed Up.   

An important note for those who are earnestly trying to sort through the abundance of the information and misinformation about "good foods" and "bad foods" in search of the truth: know the source of the information being promoted and the difference between a real nutrition expert and a self-proclaimed "expert". Most medical doctors are well trained in medicine, but have less than a semester of nutrition education in the entirety of their training (there are a few rare exceptions). Medical doctors are smart, but are not typically experts in nutrition. Investigative journalists are also a talented lot, but rarely have formal education in nutrition.Registered Dietitians/Nutritionists (RD or RDN) have at least a 4 year degree in nutrition (many have an additional 2 year master's degree), have completed a clinical nutrition internship, and maintain continuing education requirements to retain their credential. THESE are the nutrition experts... along with researchers and other professionals who have advanced degrees in Nutrition. I was struck by the fact that the new film Fed Up has a list of "experts" that includes medical doctors, a psychologist, politicians and journalists...all very intelligent and respected professionals, but none with extensive training in nutrition. There are no RDN's among their "experts"... and for good reason. Most true nutrition experts do not agree with the propaganda being promoted by this film. The RDN experts know that the issue is multi-faceted and cannot be reasonably blamed on a single factor. Nutrition needs to be viewed in context of lifestyle habits, genetics, personal preferences, and so much more. Sensationalism sells... but healthy living and common sense are what will fix our nation's failing health.

FooDS May 2014

The latest edition of the Food Demand Survey (FooDS) is now out.

Because we've been conducting the survey for over a year now, we are not only able to report changes relative to the previous month but also changes relative to the same month last year.

This month's survey reveals willingness-to-pay (WTP) for meat products is down in May relative to April and relative to May 2013. Consumers expect higher meat prices this month and report spending more on food at home and away from home.    

Some of the biggest changes witnessed this month relate to a spike in how much consumers said they heard, and how concerned they said they were, about greenhouse gasses.  The result is likely a consequence of the widely publicized release of a report on climate change by the White House on May 6 (the National Climate Assessment update).  

We also added some ad hoc questions to gauge public support/opposition for the controversial laws that seek to prohibit release of undercover reporting at animal production facilitates (these are derogatorily known as "ag gag" laws).

We randomly allocated participants to one of two groups.  The first group was told and asked the following:

Several state legislatures have considered bills to outlaw certain activities on livestock facilities.  The laws would prohibit a person entering an animal or research facility to take pictures by photograph, video camera, or other means with the intent to commit criminal activities or defame the facility or its owner.  the laws would also charge a person with a crime if he or she willfully obtains access to an agricultural production facility by false pretenses or knowingly makes a false statement or misrepresentation as part of an application for employment at an agricultural production facility with the intent to commit an act no authorized by the owner. Would you support or oppose such legislation?  

The second group was asked the same question except the first sentence was altered to provide some context for the laws and give some insight as to why the laws are coming about.  The first sentence for this group read:

In response to the release of undercover videos revealing cases of animal cruelty by animal activist organizations, agricultural groups have lobbied legislatures in several states to introduce bills to outlaw certain activities on livestock facilities.  

Here's what we found:

Regardless of which group a participant was randomly assigned, more people supported than opposed such laws.  Unexpectedly, adding contextual information increased the level of support for the laws.  Interestingly, providing contextual information also increased opposition as well.  This means that it moved people out of the "undecided" category.  Given that there are about 500 people in each group, the margin of error (or sampling error) on these questions is plus or minus 4.4%.  With the 1st group, we can be pretty confident there are more supporters than opponents, but with contextual information, there is a statistical dead heat.  

Cost of Calories and Protein from Meat

Yesterday I gave a talk for some of the world's largest pork producers as part of an event put on by PIC, the world's largest supplier of pork genetics. 

In my presentation, I touched briefly on the environmental impacts of meat production, and showed the following slide, which made the rounds on Twitter yesterday.

I thought a few points of clarification and expansion were in order.  

First, note that Bailey Norwood and I published a paper a few years ago comparing the costs of producing different meats to producing corn, soybeans, wheat, and peanuts (also note that there was a calculation error in the tables; the corrected tables are here). As we show there, it is generally less expensive to get calories or protein from corn or soybeans or wheat than it is from cattle or hogs.   That's one reason we grow such much corn, wheat, and soy - they are incredibly efficient generators of calories and protein.  

I will also note that there have been many attempt to calculate the retail cost of eating "healthy vs. unhealthy" food.  Here, for example, is a paper by the USDA-ERS.  Adam Drewnowski also has several papers on this subject.  This work often shows that meat is relatively  (relative to many fruits and vegetables) inexpensive on a per calorie or per gram of protein basis, although meat looks more expensive when placed on a per pound basis.   If you want really inexpensive calories eat vegetable oil or crackers or sugar; if you want real expensive calories, eat zucchini or lettuce or tomatoes.

The reason I picked lettuce as an example is to make the point that people often do not reason consistently when they argue we should unduly focus on costs of calories.  I have never once heard anyone say how "inefficient" production of lettuce or tomatoes or peppers are, and yet I have repeatedly heard this argument about meat.  

Another important point is that efficiency or cost isn't everything.  What do we get in return?  Who cares if lettuce is really expensive on a $/kcal basis?  A nice salad is tasty.  And healthy.  The trouble is that many of our most efficient producers of calories or protein (field corn, soybeans, wheat) are not that tasty by themselves.  Given the choice to eat a raw soybean or a raw carrot, I'll take he latter any day despite the fact that the latter is "less efficient."  

This discussion reveals another point that Bailey and I discussed in our paper.  To get corn and soy and wheat into foods we like to eat requires processing, which takes energy and is costly.  Thus, one needs to look at the costs of the foods as we eat them not as they're grown.  And, there is generally much less cost wrapped up in the processing of meat and animal products than there is for grain-based products (based on the farm-to-retail price spreads reported by the USDA).

Finally, note that one of the ways we process corn and soybeans into something we like to eat is by feeding them to animals.  Animals convert relatively untasty grains into tasty milk, eggs, and meat.   And even if some energy is "lost" or "wasted" in that process, we're getting something in return.  Here's what I previously had to say about that:

Almost no one looks at their iPad and asks, "how much more energy went into producing this than my old Apple II." The iPad is so much better than the Apple II.  We'd be willing to accept more energy use to have a better computer.  Likewise a nice T-bone is so much better than a head of broccoli.  I'm willing to accept more energy use to have a T-bone than a head of broccoli.