Blog

The Ebbs and Flows of Fashionable Food

A recent article in Forbes ran under the headline “Regenerative Agriculture: The Next Trend In Food Retailing.” It appears regenerative is a trend that is taking a while to get going. Here is my comment on an article in the New York Times from almost exactly one year ago today.

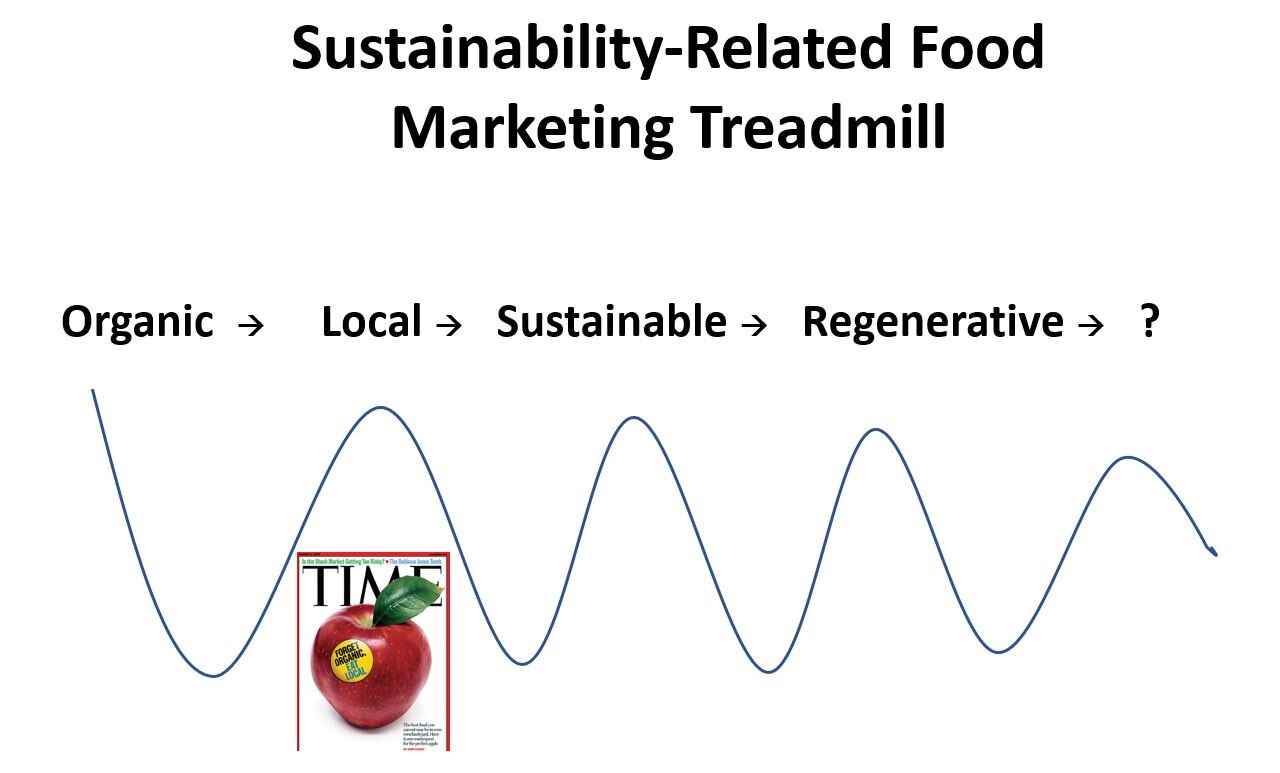
As shown in the figure below - taken from a presentation I gave about a month ago - Time Magazine had a cover image that said “Forget Organic. Eat Local” back on 2007. We subsequently seemed to move from local to sustainable. Now it’s regenerative. Next, it will be something else.

What causes the rise and fall, or rather the rise and plateau, of various food marketing claims?

treadmill.JPG

None of these movements would have any traction if there wasn’t at least some underlying demand from consumers and investors for lowering the environmental impacts of food production, improving our health, giving farm animals a desirable life, or improving incomes of small farmers. That these base concerns exist provides the context for new movements to make their case for a place on dinner plates. Given that background context, upswings of food movements are driven the following factors.

  • Desire for authenticity and trustworthiness,

  • Myth making and seeking (“silver bullet” solutions that solve all the food system ills - environment, health, food security, and otherwise - seem particularly persuasive),

  • Romanticism of the small and natural,

  • Status-seeking (food as fashion), and

  • A core of committee devotees who are able to garner institutional support for the movement.

At some point, these movements lose their luster and become blasé. It’s not that the movement “dies” (e.g., organic food still appears to be experiencing strong sales growth), but rather the movements eventually lose their moral force and cultural cache. Why?

Here are a few thoughts.

  • As a movement grows, there is a need for standardization. What, exactly, is “local”? Food grown in your same state? Or region? Within 100 miles? Or 50 miles? What is “regenerative”? I still don’t know the answer to the last one. In the case of organic, competing definitions and conflicting standards ultimately led to U.S. federal standards and a certification program in 2002. While certification helps improve transparency and consumer communication, choices made in the process can alienate “true believers.” Consider, for example, the contentious issue of whether hydroponic crops can obtain an organic certification. Whatever decision the USDA made on that question (and countless others) was going to create winners and losers, with some people arguing that the movement has lost it’s way to gain mainstream appeal.

  • Corporatization and greenwashing. When these movements are small and growing and attracting consumers, the profits generated attract new entrants and competition, which eventually include “Big Food” and “Big Ag.” Large players can bring new knowledge, economies of scale, and open marketing channels, which helps bring down cost and helps the movement grow. However, many of these food movements are premised on the appeal to “natural” and “small,” and in many ways the movement ideology is often antithetical to scale. The very things that need to happen to mainstream a movement undermine credibility among a certain set of movement promoters.

  • Science evolves. When a movement is new and undefined, as “regenerative” is at the moment, it is easy to attach to it all of one’s hopes and dreams of food system reform. But, as the movement becomes more defined and standardized, scientists begin to conduct studies and find that the world is complex and nuanced. Studies find, for example, that organic food isn’t substantively more nutritious than conventionally produced food; and, that while organic uses fewer synthetic pesticides it also has lower yields and thus requires more land to produce the same amount of food. Studies find that localness of food has little relationship with greenhouse gas emissions. And so on. A movement loses some of its luster when it isn’t a silver bullet.

  • Mainstreaming removes prestige. When everyone can have organic food, it is no longer cool to eat organic food. Part of the appeal of high-end fashion, in both clothes and food, is exclusivity. The high price point helps these products maintain their position as status symbols, but as standardization, corporatization, competition, and scale economies come about, prices often fall. For some people, and for some goods, this can lead to a type of Veblen Good Effect, where demand falls as prices fall because the good loses its position as a status symbol.

It’s unlikely we’ll ever reach a point where there aren’t ebbs and flows in sustainability-related food trends, but there may be some ways to potentially partially step off the treadmill. One possibility is to move toward more outcome-oriented and objective (rather than process-focused, subjective) sustainability labels. That said, the advent of nutrition fact panels seems to have done little to stop the cycle of dietary-related fads and trends from low fat to low carb to high protein to gluten free to plant based. Maybe these ebbs and flows are just a part of human nature.

Where are people most sensitive to changes in the price of bacon?

Whether trying to understand the impact of taxes, animal welfare regulations, or meat packing plant shutdowns, we need an elasticity of demand for pork. The elasticity of demand tell us how the quantity of pork consumers want to buy changes with the price of pork. Given the importance of such questions, it probably isn’t surprising to learn that there are many studies aiming to measure elasticties of demand. These studies typically focus on THE elasticity of demand for pork - a single aggregate number. However, these aggregate assessments likely mask a great deal of heterogeneity across markets and different products.

In some new research with Glynn Tonsor, done for the National Pork Board, we utilized grocery store scanner data from 51 U.S. retail markets for 6 different pork products to estimate 51*6 = 306 market- and product-specific own-price elasticity estimates. Our data also enables us to observe differences in consumer purchasing and spending patterns across the country.

There are so many interesting results, it’s hard to succinctly summarize. Here are a few highlights.

First, consider variation in bacon purchases across four markets over time. Of the four locations in the figure below, per-capita bacon purchases tend to be highest in Phoenix and lowest in LA (it is worth noting that bacon prices tend to be much higher in LA than Phoenix). The impact of the initial COVID-19 disruptions is also apparent in the data.

npb1.JPG

There is wide variation in price sensitivity across location and pork product. The figure below summarizes the distribution of price elasticities over the 51 markets for the six pork products

npb2.JPG

Want to know how your locale ranks in terms of consumption, prices, or elasticity? Check out the full report.

Bacon Causes Cancer: Do Consumers Care?

That’s the title of a new working paper I’ve co-authored with Purdue PhD student, Xiaoyang He. The answer to the question is: “yes,” retail bacon prices and sales fell following the pronouncement that processed meat was classified as a carcinogen; however, we did not find the same for other processed meat categories, ham and sausage. Maybe all those headlines like “The great bacon freak-out” and “Eating just one slice of bacon a day linked to higher risk…” really served to focus people’s attention. Here is the abstract:

In October 2015, the International Agency for Research on Cancer (IARC) released a report classifying processed meat as a type 1 carcinogen. The report prompted headlines and attracted immediate public attention, but the economic impacts remain unknown. In this paper, we investigate the impacts of the IARC report on processed meat prices and purchases using retail scanner data from U.S. grocery stores. We compare changes in prices and sales of processed meat products to a constructed synthetic control group (using a convex combination of non-meat food products). We find a significant decrease in bacon prices and revenues in the wake of the IARC report release, but we find no evidence of a demand reduction in ham and sausage. At the same time, we find beef sales and revenue increased significantly after the report, while beef price significantly fell.

That bacon prices fell alongside the volume sold is a clear signal that consumer demand for bacon fell as a result of the IARC report.

As we discuss in the paper, a key challenge with identifying the effects of the IARC report rests in constructing a counter-factual prediction of what would have happened to prices and sales of processed meat products had the IARC report not been released. We cannot use data from an unaffected location because the media reports were widely distributed across the U.S. Instead, we use statistical methods (the so-called synthetic control method) to identify alternative food products as controls. We describe the approach as follows:

The synthetic control method sidesteps this problem and uses a combination of candidate controls instead. We Nielsen retail scanner data to determine the effect of the IARC report on processed meat markets. This data contains weekly information regarding sales, price, and revenue for processed meat categories as well as categories that are included in the synthetic control group. We use the data from 2014 to 2016, which includes approximately one year of data before and one year of data after IARC report released date. The post-IARC time period is long enough to determine, if any impact exists, how long it lasts.

In essence we use the the estimated relationship among dozens of possible grocery item prices and bacon prices prior to IARC report release to predict what bacon prices would have been had the report release not occurred. Here is the calculation of actual and counter-factual bacon prices ($/oz) before and after the report release:

baconIARC.JPG

After a few weeks of bacon prices remaining above their predicted values, bacon prices ultimately averaged 6.5% lower than what we predict would have occurred had the IARC report not been released.

You can read the whole thing here.

The non-price effects of soda taxes and bans

The American Journal of Agricultural Economics just published a paper I co-authored with Sunjin Ahn, who is a post-doc at Mississippi State University entitled “Non‐Pecuniary Effects of Sugar‐Sweetened Beverage Policies.” (for the non-economists out there, “non-pecuniary” just means non-price).

Here was our motivation for the study:

There is some market evidence that passage of SSB [sugar sweetened beverage] taxes might generate outcomes beyond that predicted by price elasticities (or the pecuniary effects). Non‐pecuniary effects could amplify the effects of a tax, increasing the intended effects of the policy. In particular, the tax (and the debate and publicity surrounding it) could send information to consumers about the relative healthfulness of beverage options and send cues as to which choices are “socially acceptable”
...
Signaling and information effects associated with SSB taxes are only one potential non‐pecuniary effect, and it is possible that some non‐pecuniary factors, such as reactance, could dampen the effects of a tax, and in the extreme could result in outcomes opposite that intended by the policy. ... Reactance is thought to arise from perceptions of threats to individual freedom, among other factors (Brehm 1966). Thus, although it seems clear that non‐pecuniary effects might exist, the size and the direction of the effect is ambiguous.

We tackled this issue by conducting a series of experiments through surveys with consumers. We asked consumers to participate in a series of simulated grocery shopping exercises. Consumers first made choices between beverage options at a given set of prices, and then they were randomly allocated to different treatments where either:

  • A) prices of SSB increased but respondents were not told why,

  • B) prices of SSB increased and respondents were told it was a result of a soda tax,

  • C) prices of SSB increased and respondents were told it was a result of a shortage of sugar beets and sugar cane,

  • D) the size of SSB was reduced but respondents were not told why,

  • E) the size of SSB was reduced and respondents were told the reduction was due to a government ban on large sized sugared sodas, or

  • F) the size of of SSB was reduced and respondents were told the reduction was due to a plastic shortage.

By comparing how choices of SSBs change when people were told prices or size changes were a result of a policy vs. other non-policy factors, we can get a sense of the size and direction of the non-pecuniary effects.

When conducted our first study in 2016, we found significant results related to the SSB taxes. In particular, our results suggested people who were told price changes were a result of a tax were more likely to choose SSB than people who were not given a reason for the price change. We certainly weren’t the first to find such an effect. Here is a bit about previous research on this topic:

Just and Hanks (2015) argued that consumers might respond with resistance when a new policy obstructs their ability to obtain their preferred option. They argued that the phenomenon arises because consumers are emotionally attached to consumption goods, resulting in reactance. Policies perceived as paternalistic might cause consumers to “double down” on purchases of forbidden or restricted goods (Lusk, Marette, and Norwood 2013). Just and Hanks (2015) constructed a model in which controversial policies such as a sin tax could lead to an increase in the marginal utility for a good, potentially leading to increased consumption even if prices rise. In addition, Hanks et al. (2013) found that demand for unhealthy foods under a tax frame increased while the demand for subsidized healthy foods fell. Similarly, Muller et al. (2017) found that almost 40% of low‐income individuals increased their share of expenditures on unhealthy food after an unhealthy food tax.

When we sent the paper off for review, we received a number of valuable comments, which caused us to make a number of changes to our experiment, and repeat the study with some extensions in 2019. What did we find with these newer data? On average: nothing, nada, zilch. There was no significant difference in the average market share of SSBs across the various information treatments. However, we did find significant variability in the treatment effects, meaning some people choose more SSBs when they knew it was a tax/ban and others chose less; however, these variations were only partly explained by demographic effects. In summary, our results didn’t provide a clear answer on the question we sought out to address: non-pecuniary effects, to the extent they exist, seem to work in different ways for different people, making the net effect small and hard to identify, at least in our experimental setting.

A note on the publication process is worthwhile. Normally, it is very hard to publish null results. This is problematic for the advancement of science because it results in publication biases like the file draw problem. To the credit of Tim Richards, the journal editor, and the three anonymous reviewers at the American Journal of Agricultural Economics, we received a positive reaction and ultimately, after a more changes, acceptance for publication even though we failed to replicate our previous result and found null effects. This is really an example of peer-review working at it’s best.

Unscrambling COVID-19 Food Supply Chains

That is the tile of a new paper with Trey Malone and Aleks Schaefer, both at Michigan State University. Here is the abstract:

This article uses evidence from the egg industry to investigate how the shift from food-away-from-home and towards food-at-home affected the U.S. food supply chain. We find that the onset of the COVID-19 pandemic increased retail and farm-gate prices for table eggs by approximately 141% and 182%, respectively. In contrast, prices for breaking stock eggs-which are primarily used in foodservice and restaurants-fell by 67%. On April 3, 2020, the FDA responded by issuing temporary exemptions from certain food safety standards for breaking stock egg producers seeking to sell into the retail table egg market. We find that this regulatory change rapidly pushed retail, farm-gate, and breaking stock prices towards their long-run pre-pandemic equilibrium dynamics. The pandemic reduced premiums for credence attributes, including cage-free, vegetarian-fed, and organic eggs, by as much as 34%. These premiums did not fully recover following the return to more “normal” price dynamics, possibly signaling that willingness-to-pay for animal welfare and environmental sustainability have fallen as consumers seek to meet basic needs during the pandemic. Finally, in spite of widespread claims of price gouging, we do not find that the pandemic (or the subsequent FDA regulatory changes) had a meaningful impact on the marketing margin for table eggs sold at grocery stores.

We tried to tease out the effect of the pandemic itself on egg prices from the impact of FDA rules that barred eggs from easily moving from the restaurant to the grocery market. Here’s what we find on that latter point.

These results suggest that had the FDA not suspended Egg Safety Rules for breaker producers seeking to sell into the table eggs market - farm-gate and retail table egg prices would have been approximately 53% and 56% higher than those observed in the last week of May. On the other hand, breaking prices in the same week would have been about 50% lower.

The key results as they related to impacts on commodity egg prices are shown in the following graphs (the dashed lines are our forecasts of what would have happened had COVID19 not occurred).

eggpriceimpacts.JPG

You can read the whole paper here.