Blog

Impacts of health information on perceived taste and affordability

The journal Food Quality and Preference just released a new paper I co-authored with Jisung Jo, a former student who now works at the Korea Maritime Institute.

Here is the motivation for the work:

One of the key mechanisms policy makers have utilized to encourage healthier eating is the provision of information via nutritional labels. However, research has shown that the provision of health information does not necessarily increase consumption of healthy foods ... A possible reason for the largely ineffectual impact of nutritional labeling might be because health information not only updates consumers’ health perceptions but also affects other perceptions, such as taste and affordability, which are the primary drivers of consumer purchase behavior

In other words, if you see a new labeling indicating a food is healthier than you previously thought, do you now think it will be less tasty?  Or more expensive?  

To explore this issue, we surveyed consumers in three different countries (US, China, and Korea).  We showed consumers a picture of a food item and asked them to rate the item, on simple scales, in terms of perceived taste, health, affordability, and purchase intention.  We did this for 60 diverse food items. Then, the ratings of all 60 foods was repeated after the subjects had received information about each food item’s healthiness, which was conveyed via a "traffic light" labeling system (green=healthy, yellow=medium healthiness, red=unhealthy).   Here's an example of one of the questions asked before and after the information:

jisungFQP1.JPG

Unsurprisingly, the provision of "green" labels tended to increased perceived healthiness and the provision of "red" labels tended to reduce perceived healthiness.  Of more interest is how these labels affected perceptions of taste, affordability, and ultimately purchase intentions.  

Unexpectedly, we found that providing information that a food was healthier than people previously thought tended to increase perceived taste.  People also tended to think items that are less healthy than previously thought will ultimately be less expensive.

We created the following graph to look at how projected changes in purchase intentions (after provision of health information) would change if one ignores the fact that health information also affects perceived taste and affordability.
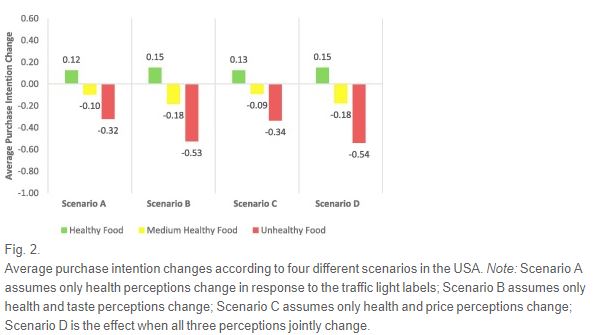
jisungFQP2.JPG
Across all scenarios and in all three countries, we find that negative health information has the biggest effects on purchase intention changes. Intriguingly, the average purchase intention in scenario B is larger than that in scenario A. The values for scenario D are the same as the actual average of purchase intention (since they are just the model evaluated at the mean effect changes of all variables included in the model). Comparing the purchase intention changes as one moves from scenario A to D shows the effect of ignoring integrated health-taste-affordability perceptions.

Overall, this research underscores the need to understand how labels which convey health information might also alter other perceptions related to taste and affordability.

Agricultural Marketing and Price Analysis

About 10 years ago, Bailey Norwood and I published an undergraduate textbook entitled Agricultural Marketing and Price Analysis.  The book was originally published by Prentice-Hall. Over the years, we'd considered revising and updating various portions of the book, but the publishers were never appeared interested in releasing a second edition.    

Now, Waveland Press was secured the rights to publish the textbook (their site for the book is here).  For now, this is just a reprint of our original version, but they've agreed to put out a new edition in the future as well.  Bailey and I will probably pick up a couple co-authors who have been using the book in class.  More on that in a year or two when a new edition is set to drop. 

For now, you can enjoy the new cover.

lusk_norwood_book.JPG

Or, if you can read Greek, you can also buy that translation here

lusk_norwood_book_greek.JPG

A primer on USDA food assistance programs

With the help of my colleagues and the leadership of Maria Marshall and Kami Goodwin, the Department of Agricultural Economics at Purdue has a new effort to educate and provide analysis around food and farm policy issues.  We are calling it: Policy Briefs by the Purdue Agricultural Economics Department. Here's a short summary from the new website:

We are pleased to launch Policy Briefs by the Purdue Agricultural Economics Department. We aim to provide short insights, readable for the general public, on policy issues that are national in scope with an Indiana flare. We were initially motivated by the need to provide timely analysis in the lead up to 2018 Farm Bill discussions. However, the breadth of expertise in our department and the ongoing policy discussions related to farm, food, environment, trade, and development issues warrants a longer view and broader scope. The plan is to add new briefs on a monthly basis, although we may add more frequent contributions when more timely information is needed. We hope to enrich policy debates by providing data and context, quantifying impacts, and offering alternatives.

If you click on the link to the site, you'll see a couple short pieces by Roman Keeney explaining the Farm Bill and providing some background context for upcoming Farm Bill debates.  We also recently added a post by yours truly providing a short primer on USDA food assistance programs.  I provide an overview of programs like SNAP (aka "food stamps"), WIC, and school lunch, provide some history, look at the effects of SNAP, and outline some of the proposals to change SNAP.  All that in only about 1,000 words!

Here are the first two paragraphs from the piece:

Looking just at spending, the U.S. Department of Agriculture (USDA) and the Farm Bill might be more aptly described as the U.S. Department of Food Assistance and the Food Assistance bill. In 2017, the USDA is estimated to spend about 77% of its $133 billion in outlays on food assistance programs.

USDA food assistance programs are administered by the Food and Nutrition Service (FNS), and the largest program administered by FNS is the Supplemental Nutrition Assistance Program (SNAP), historically known as “food stamps.” About 70% of the FNS budget authority is allocated to SNAP. The next largest programs, representing about 21% and 6% of FNS budget authority, are Child Nutrition Programs (CNP) and the Women, Infants, and Children (WIC) programs. The CNP primarily delivers free and reduced-price breakfasts and lunches to school children. In December 2017, about 22 million school children participated in the free or reduced lunch program and about 12.6 million participated in the free or reduced breakfast program. The WIC program primarily targets women who are pregnant or who have infant children by providing coupons for infant formula, milk, cheese, and other staple foods. There were about 6.9 million WIC participants in December 2017. SNAP and CNP are entitlement programs (i.e., every person who meets eligibility criteria is allowed to participate), but WIC is a discretionary program whereby the federal government grants a specific dollar amount to be spent each year.

Want non-GMO? How much more will it cost?

The journal Food Policy just released a new paper I co-authored with Nicholas Kalaitzandonakes and Alexandre Magnier entitled, "The price of non-genetically modified (non-GM) food." 

As retailers consider reformulating products or how they'll respond to new mandatory labeling laws, it is important to consider how these decisions may affect the prices consumers pay for foods that avoid GMOs.  The matter is increasingly of note because sales of non-GMO products have significantly risen over time (below is a graph from the paper showing the trend in sales of breakfast cereal making non-GMO claims).

nongmocerealsales.JPG

In the paper, we used a U.S. national sample of grocery store scanner data from the years 2009- 2016 to investigate the prices stores charged for 144 different salad and cooking oil products (or Universal Product Codes, UPCs), 1,288 tortilla chip UPCs, 2,227 breakfast cereal UPCs, and 5,626 ice cream UPCs. We picked these product categories because they represent classes of products for which the potential impact of changes in the raw ingredients on the final retail price might be large (i.e., soybean or corn oil for which the supply is primarily GMO) to small (i.e., ice cream where the value share of GMO crops and their derivatives (e.g. corn syrup) is probably less than 5%).

Here's a short summary:

we use hedonic modeling to estimate the retail price premiums consumers paid during the 2009–2016 period for non-GM and organic foods in four product categories: breakfast cereal, tortilla chips, salad and cooking oil, and ice cream. There are almost 11,000 ready-to-eat foods in our sample, 1350 of which are labeled as non-GM or organic. We selected these four product categories for their differences in the value shares of GM ingredients and hence their potential differences in reformulation costs. We show that the estimated price premiums for non-GM and organic foods in these four product categories are in line with the expected added costs for supplying such products.

The key results are summarized in the table below:

nonGMOprice.JPG

We write:

The estimated price premiums paid by US consumers over the 2009–2016 period, 9.8% to 61.8% for non-GM products and 13.8% to 91% for organic products in the four categories examined here, are orders of magnitude higher than those projected by economic impact analyses of proposed mandatory GM labeling produced in recent years

and

Perhaps the most important conclusion to be drawn from our results is that non-GM foods are more costly than GM foods, and policies that encourage food companies to shift toward non-GM ingredients are likely to increase food costs. Our results therefore suggest that there is a pressing need for further research in order to clarify the added costs consumers may have to pay under mandatory disclosure of GM ingredients and how such added costs might be distributed.

Market Potential for Cage Free Eggs

Many food manufacturers and retailers have made pledges to go "cage free."  In fact, if all the pledges are maintained, about 75% of the entire egg laying flock will have to be converted to cage free by the year 2025, as the graph below suggests.     

eggmarketshare.JPG

Is there sufficient consumer demand to support this level of commitment (particularly when one acknowledges that, according to USDA data, cage free eggs are currently selling at about a $1/dozen (or 68%) premium to conventional)?

I recently completed a study for the Food Marketing Institute, Animal Agriculture Alliance, and the Foundation for Food and Agricultural Research on the market potential for cage free eggs to help provide some insights into these issues.

The study was conducted with more than 2,000 consumers.  The core of the study involved people making a series of simulated retail shopping choices like the one below.  

CE_egg.JPG

Answers to these questions allow us to infer consumer willingness-to-pay, market shares, and more.  In fact, if you want to run your own market share simulations, I created this handy downloadable spreadsheet.

The main finding is the following:

When provided no additional information, choices imply half of consumers are willing to pay no more than a $0.30/dozen premium for cage free eggs; however, the mean premium is $1.16/dozen, suggesting a small fraction of consumers are willing to pay sizeable amounts for the cage free label. Almost 60% of consumers have a willingness-to-pay for cage free less than $0.40/dozen, but 33% have a value greater than $1.00/dozen.

and

Ultimately, the results suggest there is potential for the market-share for cage free eggs to rise above the current state even at premiums as high as $1.00/dozen. However, even at much more modest price premiums, the potential for cage free eggs to attain majority market share is unlikely, particularly if conventional eggs advertise other desirable attributes. Completely removing more affordable conventional eggs will significantly increase the share of consumers not buying eggs.

Here are a couple key graphs:

WTP_hist_egg.JPG

and

eggmarketshare2.JPG


There is much, much more in the full report, and you can also download the market share simulator here.